|
Now you can plot your own chart
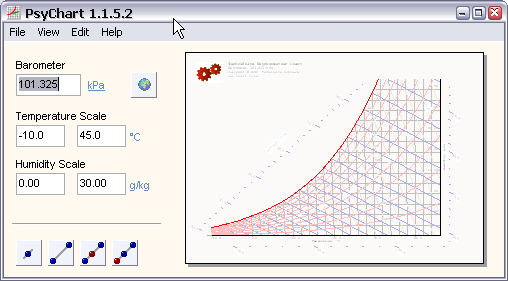
This is a good old fashioned psychrometric chart, you know, the paper type. Our ChartPlotter program will let you generate a conventional paper psychrometric chart to suit your barometric pressure, temperature range and humidity range.
Because the chart is generated on the computer, it is possible to send data to it from other programs and it will plot your process on the chart. We have built this feature into our PsyChart program. Now, you can have the best of both worlds. In the PsyChart program, the computer does all of your calculations. Finally, when you need a decent chart for your report, click on the PlotChart button and PsyChart will transfer the processes for you. If you are like me, you will want to email the chart to others. The program allows you to save the file in any of the common formats (bmp, jpg or gif) so that it can be emailed or used in your reports. In addition, if you change the printer driver to a pdf writer, you can easily save the psychrometric chart as a pdf file.I started writing this program after I heard that the very professional CSIR (Council for Scientific and Industrial Research) psychrometric chart was printed from a manual template. The challenge was to be able to automatically generate the complete chart. Try it out for yourself, its FREE...
|