|
Actually it is log Pressure versus Enthalpy
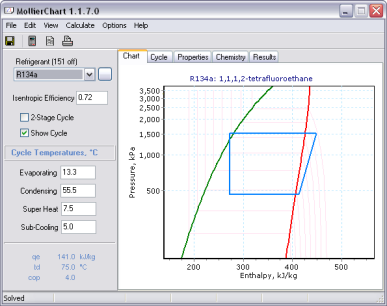
If you need to compare the performance of refrigerants, this program will suit your needs. It is very easy to use and gives the basic cycle performance both graphically and in text form.
Simply enter the cycle parameters and select a refrigerant. The Pressure/Enthalpy will be plotted, showing the resultant vapour compression cycle. The program allows you to compare the simple 1-stage and 2-stage cycles.
There are 151 refrigerants currently in the library: R22, R12, R134a, R502, R404A, R507A, R717, R407C, R410A, R23, R170, R290, R600a, R740, 1-butylene, C6H6, R600, n-dodecane, (Z)-2-butene, perfluorobutane, perfluoropentane, R744, COS, C6H12, C3H6, D2O, n-decane, RE-170, methyl carbinol, R1150, F2, H2S, n-heptane, n-hexane, R702, methylpropene, i-C6H14, R601a, Kr, R50, nitrogen oxide, C5H12, NF3, n-nonane, n-octane, R732, R702p, R601, R1270, methyl acetylene, R11, R113, R114, R115, R116, R123, R124, R125, R13, R14, R141b, R142b, R143a, R152a, R21, perfluoropropane, R227ea, R236ea, R236fa, R245ca, R245fa, R32, R41, RC318, SF6, R764, (E)-2-butene, CH3-C6H5, R718, Xe, R401A, R401B, R401C, R402A, R402B, R403A, R403B, R405A, R406A, R407A, R407B, R407D, R407E, R408A, R409A, R409B, R410B, R411A, R411B, R412A, R413A, R414B, R500, R501, R503, R504, R508A, R508B, R509A, dimethyl ketone, benzene, iodotrifluoromethane, carbon oxide, carbon oxysulfide, hexahydrobenzene, trimethylene, deuterium, deuterium oxide, fluorine, dihydrogen monosulfide, methylpentane, methyl alcohol, R744A, tetramethylmethane, Trifluoroamine, R728, R365mfc, sulfur fluoride, toluene, Air, R414A, R415A, R415B, R416A, R417A, R418A, R419A, R420A, R421A, R421B, R422A, R422B, R422C, R422D, R423A, R424A, R425A, R426A, R427A, R428A, R729. If you want me to add a refrigerant, just send me an email or post a message into the guestbook.
The chart shows the pressure, temperature and enthalpy at the current mouse position. This makes it easy to read the chart without having to interpolate on the logarithmic scale as you would need to do on a paper chart.
On the cycle page, you will see a schematic of the cycle with the main points labeled. In this case, a two stage cycle. The Mollier Chart is the ideal tool for evaluating refrigeration system performance. But, when you have site measurements that seem to be confusing you may need some help.
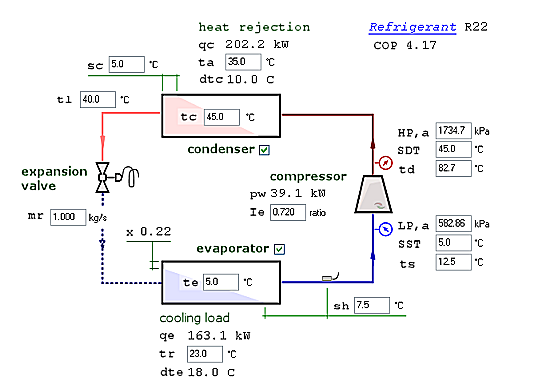
Our new program, RefDiag, is a tool that will help you to locate problems.
You just enter the measured values onto the graphic and the following values are calculated. Coefficient of Performance (COP). Heat exchanger duties. Evaporator entering quality. Compressor discharge temperature.
The diagnostic function then suggests the potential system problem...
|
 On the results page, you will get a detailed list of all the points around
the cycle. This includes refrigerating effect and cycle COP.
On the results page, you will get a detailed list of all the points around
the cycle. This includes refrigerating effect and cycle COP.